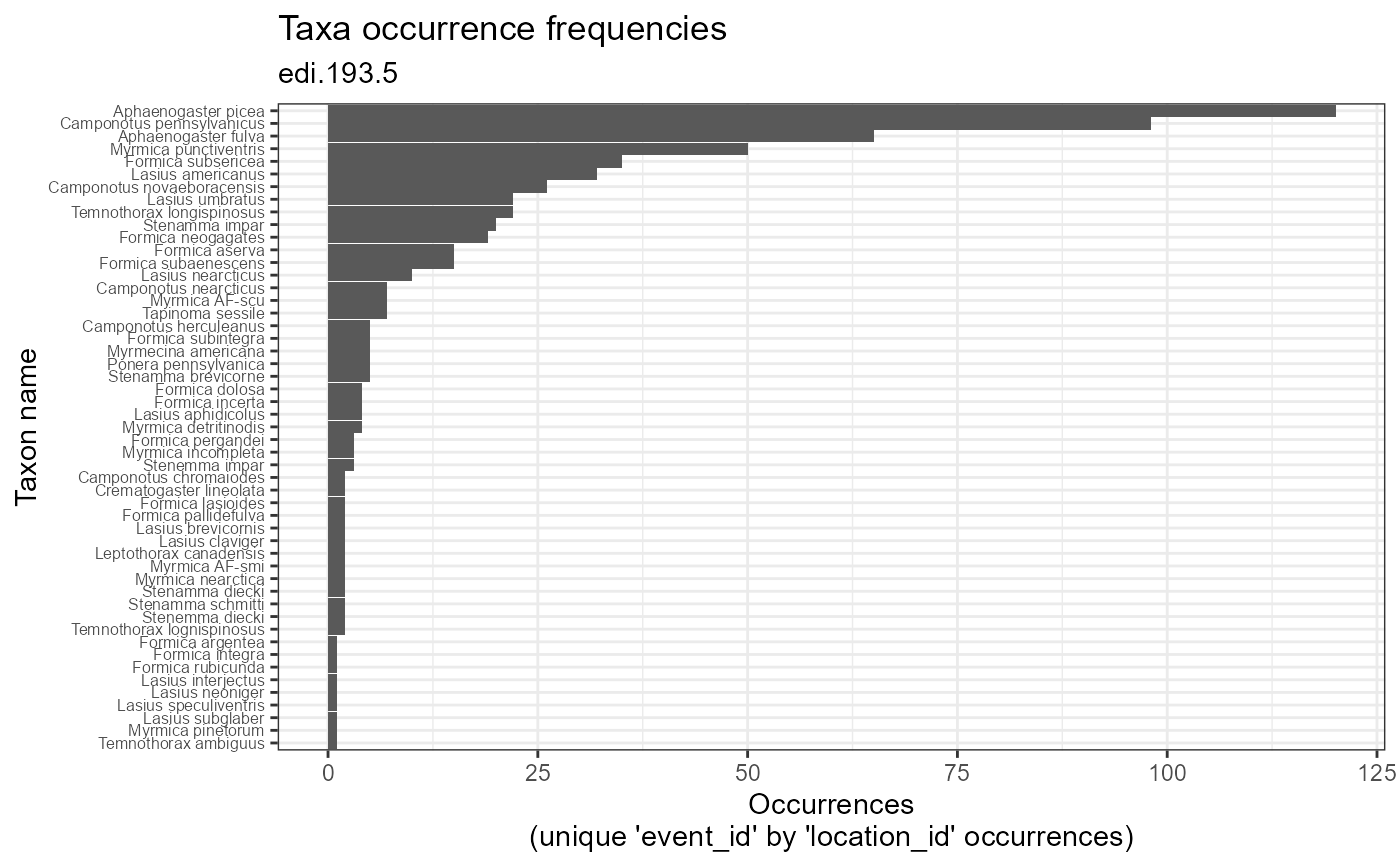
Plot taxon occurrence frequences as the number of 'event_id' by 'location_id' combinations in which a taxon is observed.
plot_taxa_occur_freq(
  data,
  id = NA_character_,
  min_occurrence = 0,
  facet_var = NA_character_,
  color_var = NA_character_,
  facet_scales = "free",
  alpha = 1
)
Arguments
- data
(list or tbl_df, tbl, data.frame) The dataset object returned by
read_data(), a named list of tables containing the observation and taxon tables, or a flat table containing columns of the observation and taxon tables.- id
(character) Identifier of dataset to be used in plot subtitles. Is automatically assigned when
datais a dataset object containing theidfield, or is a table containing the package_id column.- min_occurrence
(numeric) Minimum number of occurrences allowed for taxa included in the plot.
- facet_var
(character) Name of column to use for faceting. Must be a column of the observation or taxon table.
- color_var
(character) Name of column to use for plot colors.
- facet_scales
(character) Should scales be free ("free", default value), fixed ("fixed"), or free in one dimension ("free_x", "free_y")?
- alpha
(numeric) Alpha-transparency scale of data points. Useful when many data points overlap. Allowed values are between 0 and 1, where 1 is 100% opaque. Default is 1.
Value
(gg, ggplot) A gg, ggplot object if assigned to a variable, otherwise a plot to your active graphics device.
Details
The data parameter accepts a range of input types but ultimately requires the 13 columns of the combined observation and taxon tables.
Examples
if (FALSE) {
# Read a dataset of interest
dataset <- read_data("edi.193.5")

# Plot the dataset
plot_taxa_occur_freq(dataset)

# Facet by location and color by taxon_rank
plot_taxa_occur_freq(
  data = dataset,
  facet_var = "location_id",
  color_var = "taxon_rank")

# Color by location and only include taxa with >= 5 occurrences
plot_taxa_occur_freq(
  data = dataset,
  color_var = "location_id",
  min_occurrence = 5)

# Flatten, filter using a time cutoff, then plot
dataset %>%
  flatten_data() %>%
  dplyr::filter(lubridate::as_date(datetime) > "2003-07-01") %>%
  plot_taxa_occur_freq()
}
# Plot the example dataset
plot_taxa_occur_freq(ants_L1)