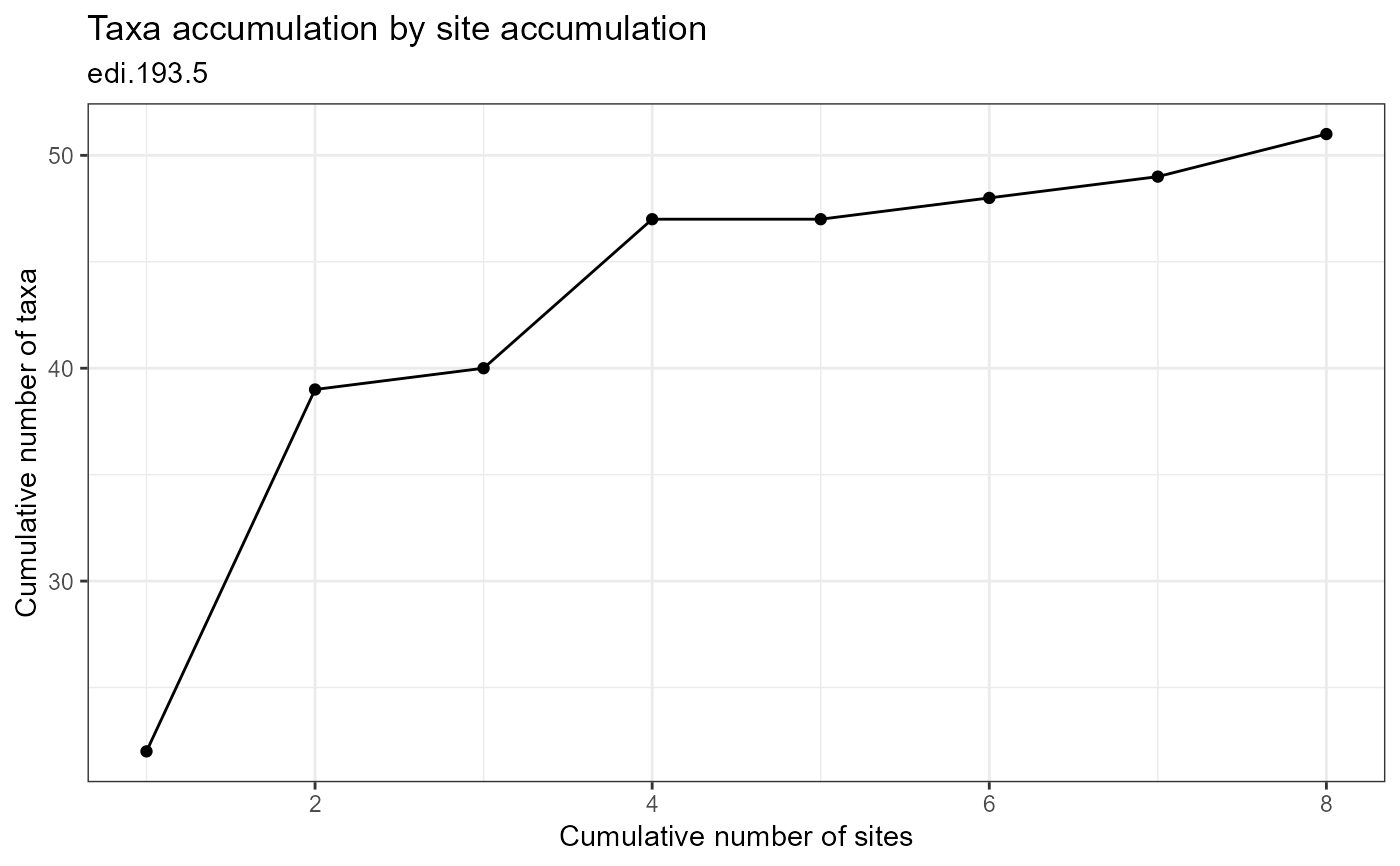
Plot taxa accumulation by site accumulation
plot_taxa_accum_sites(data, id = NA_character_, alpha = 1, observation = NULL)Arguments
- data
(list or tbl_df, tbl, data.frame) The dataset object returned by
read_data(), a named list of tables containing the observation table, or a flat table containing columns of the observation table.- id
(character) Identifier of dataset to be used in plot subtitles. Is automatically assigned when
datais a dataset object containing theidfield, or is a table containing the package_id column.- alpha
(numeric) Alpha-transparency scale of data points. Useful when many data points overlap. Allowed values are between 0 and 1, where 1 is 100% opaque. Default is 1.
- observation
(tbl_df, tbl, data.frame) DEPRECATED: Use
datainstead.
Value
(gg, ggplot) A gg, ggplot object if assigned to a variable, otherwise a plot to your active graphics device
Details
The data parameter accepts a range of input types but ultimately requires the 9 columns of the observation table.
Examples
if (FALSE) {
# Read a dataset of interest
dataset <- read_data("edi.193.5")

# Plot the dataset
plot_taxa_accum_sites(dataset)

# Flatten the dataset, manipulate, then plot
dataset %>%
  flatten_data() %>%
  dplyr::filter(lubridate::as_date(datetime) > "2003-07-01") %>%
  plot_taxa_accum_sites()

# Plot from the observation table directly
plot_taxa_accum_sites(dataset$tables$observation)
}

# Plot the example dataset
plot_taxa_accum_sites(ants_L1)